Stock Market Volatility and the VIX
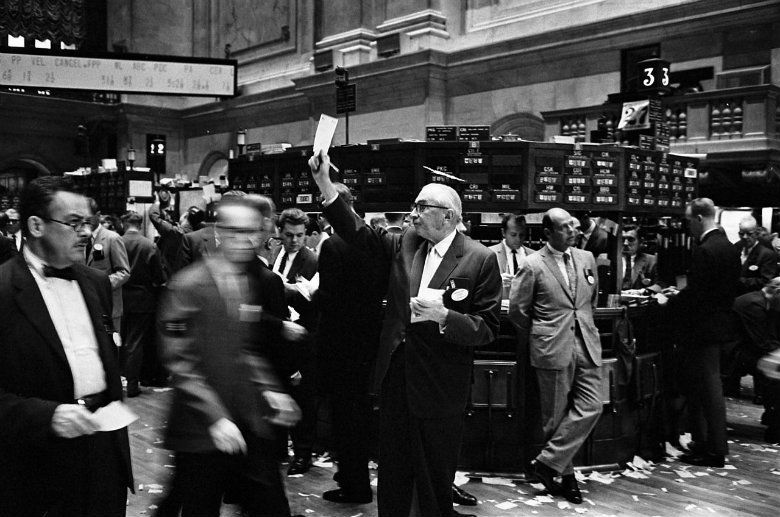
There have been many winds in the stock market of late. US stock indices have witnessed much volatility this year, bringing much confusion and ‘warranted fear’ among investors. So much has been the noise that for the first time, in recent history, a US President has commented about the stock market, even in official White House communication.
Understanding the VIX Index
When there is so much ‘fear’ in the market, investors have always turned to the much-touted ‘fear gauge’, or the VIX index, to ensure they are not caught up in any kind of market trap. With many analysts and pundits drawing up comparisons of the current volatility with past market crashes, it is vital for investors to understand the VIX, its components, and how it can be harnessed when trading the stock market.
The VIX is a calculated index, but unlike other market indices, it is not computed from stock prices but from option prices, and in particular, the S&P 500 index. The idea is to attempt to forecast expected implied volatility in the market. The keyword is ‘expected’, as the VIX is not an outright representation of what is or will happen, but rather the amount of risk or premium investors might be willing to pay to buy or sell stocks in the market. The price of VIX is determined just like in any market: buyers and sellers influence options prices; more buyers will push premiums up, while more sellers will push premium prices down.
Thus, computationally, the VIX index is a weighted average of option prices in the S&P 500 index. The S&P 500 index has a notional value in excess of $100 billion, and given that the VIX tracks its movement, it has assumed the status of ‘investor-mood detector in chief’ in the US stock market.
The computation of VIX makes it objective and mechanical. Historically, investors simply check whether the VIX is high or low. A reading below 20 generally suggests that the investing environment is healthy and there is low risk. But if it falls too low, it also signals complacency, or an overbought market, that can tumble anytime. On the other hand, a reading above 20 suggests that fear is creeping in the market, implying that investors are becoming more risk-averse and demanding less of high yielding products or currencies in the market.
Beyond the VIX Index

While VIX has served investors for over two decades now, its reading can never be substituted for hard facts, which are the actual political and economic fundamentals. A case in point is during the 2008 financial crisis where the index rose as high as over 80, then tumbled to as low as around 15 and hovered there for long periods.
This would have led investors to give the market a clean bill of health, but they would have been very wrong. But its backers have always reasoned that as a predictor of investor mood, the VIX essentially reflects a human inability to efficiently understand inherent market risk and market prices of the unknown. The idea is that volatility is a dangerous market phenomenon, and the VIX should not make it any easier or tempting. It is important to watch it, but investors should not use it by itself, but rather as an indicative and coincidental tool.
Time to Trade the VIX
There are a number of ETFs and ETNs based on the VIX and they are available for trading on the options and futures market. These are primarily used by investors to hedge long equity portfolios. There is usually an inverse relationship between the VIX and the stock market; the VIX will typically rise when the equity market is falling. The VIX has also proved very useful in the currency markets as highlighted by its acknowledgment of online forex brokers. This forex trading website publishes VIX values, so its traders can take advantage of correlations between the currency and equity markets. Ultimately, the VIX should be considered an indicative tool and not necessarily a predictor of moves in the financial markets.


